

Take a fairly standard portfolio, a mix of equities, gold and bonds. Over its history it returns 17 % a year, for a Sharpe of 1.02 and a max drawdown of −33.7 %. That last number weighs heavily when a strategy is judged, more than it should. A realized max drawdown is neither a property of the strategy nor a ceiling on future risk. It is a single event, not statistically significant.
The setup. S&P 500 + gold (GLD) + long bonds (TLT), equal-weight, rebalanced monthly, leveraged to a 15 % volatility target. Daily bars, 2016-2026. The max drawdown distribution is estimated with a GARCH calibrated on the past and simulated over the year ahead (manifoldbt engine). Rolling-window test, with the final 30 % of the data held out for a single out-of-sample measurement.
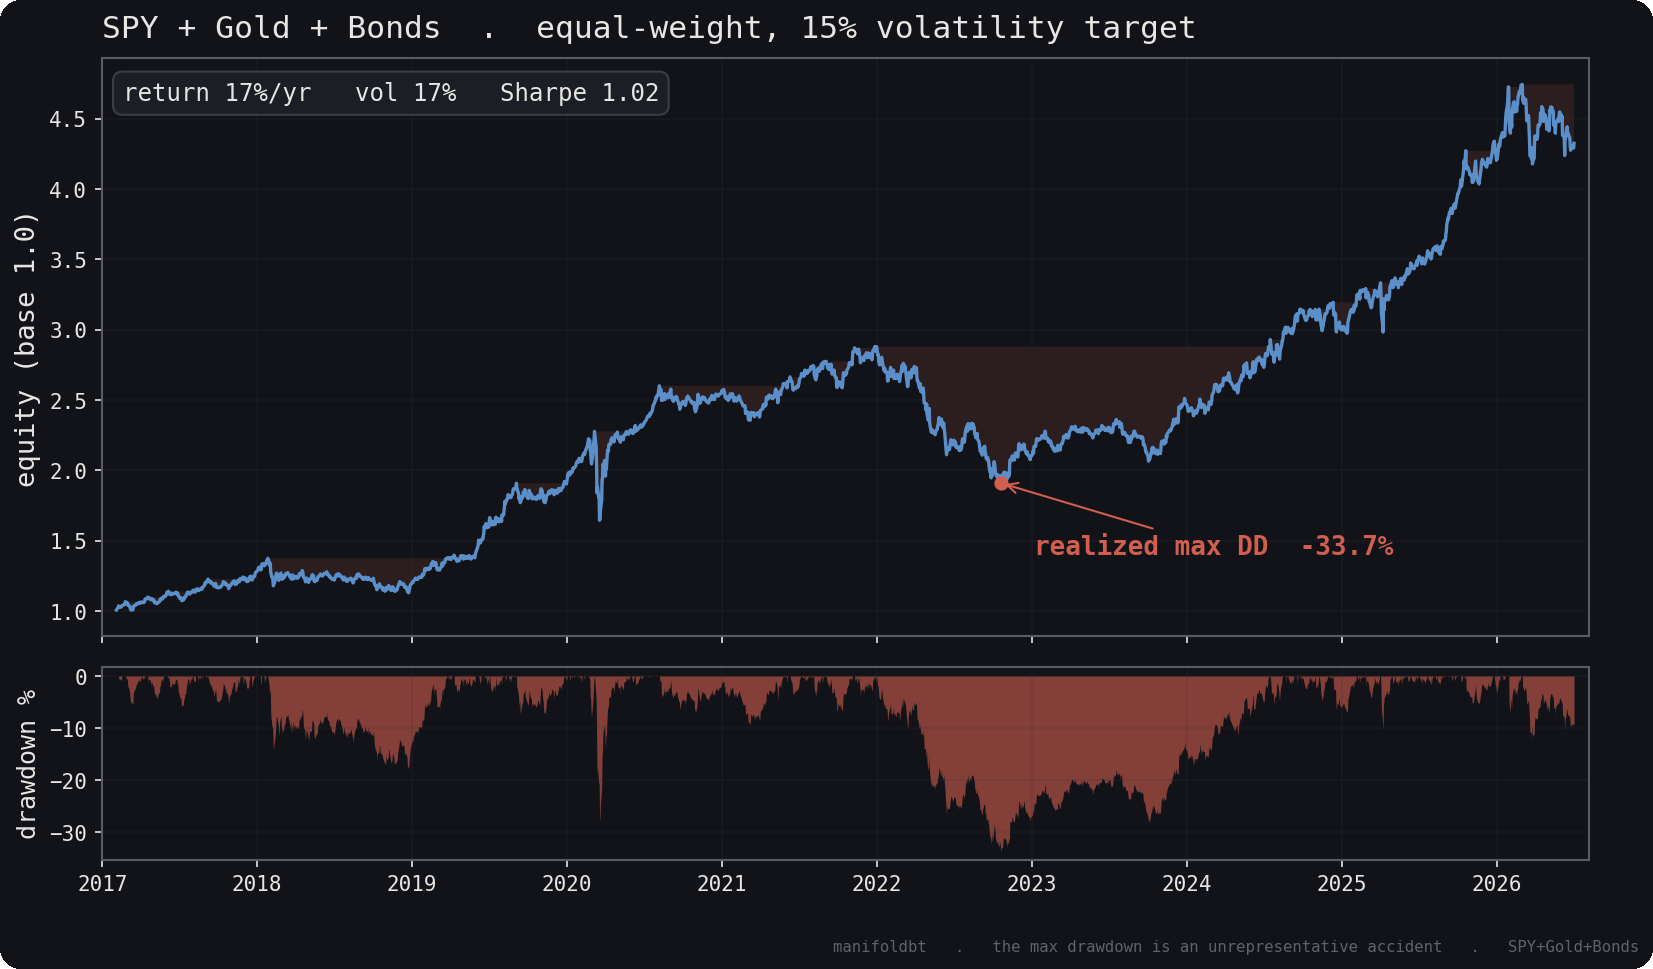
Equity and drawdown. The deepest trough dates from 2022, when the S&P 500 and bonds fell together.
1. The drawdown does not predict the drawdown
The max drawdown is the largest decline from an equity peak to the trough that follows, over the sequence of returns that happened. Its correlation from one period to the next is zero, and across the life of the portfolio it ranges from 2 % to 28 % depending on the window. A property of the strategy would carry over from one period to the next. This one has no memory.
The comparison with a genuinely stable property is telling. Volatility does have memory, which is the very principle behind the GARCH used further down. A day’s variance carries over almost entirely to the next.
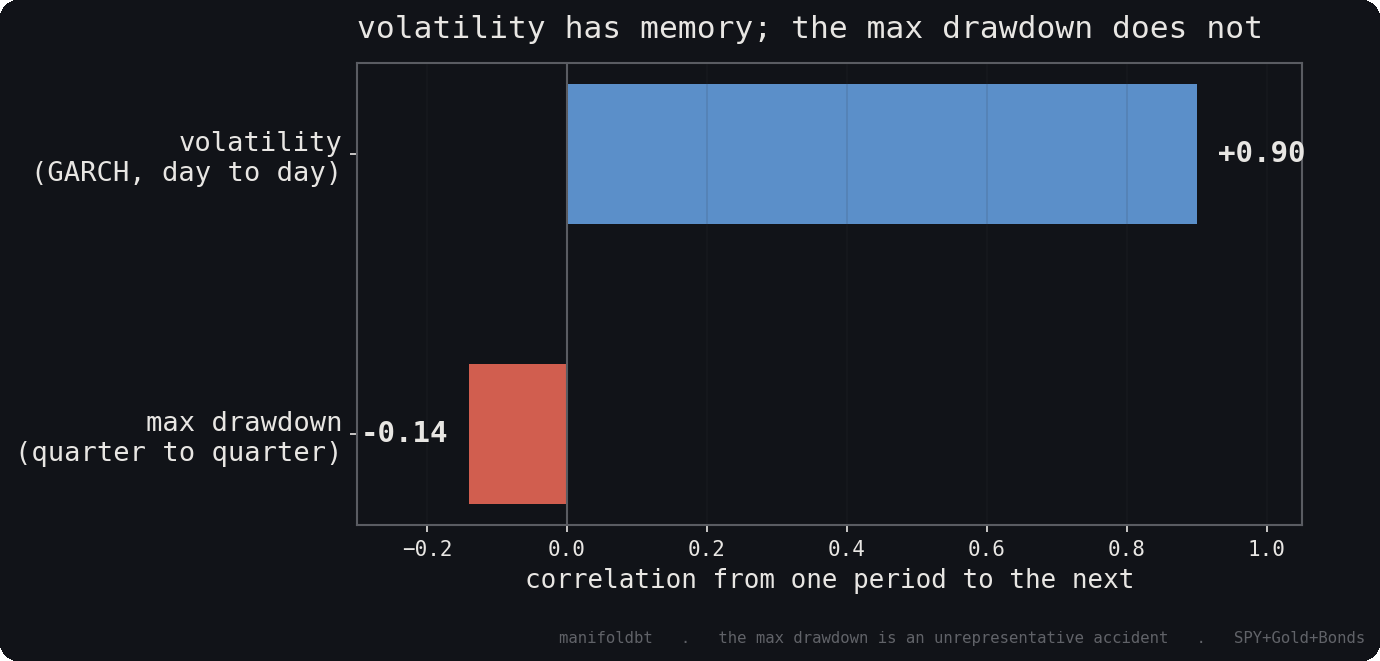
Volatility carries over from one period to the next, almost in full. The max drawdown does not: its correlation with itself is zero, even slightly negative.
The worst drawdown seen so far is no ceiling either. The following year exceeds it one time in two, and a new record is set one time in six across the strategy’s rolling windows. The worst still to come is never what has already happened.
2. The right reading: the distribution
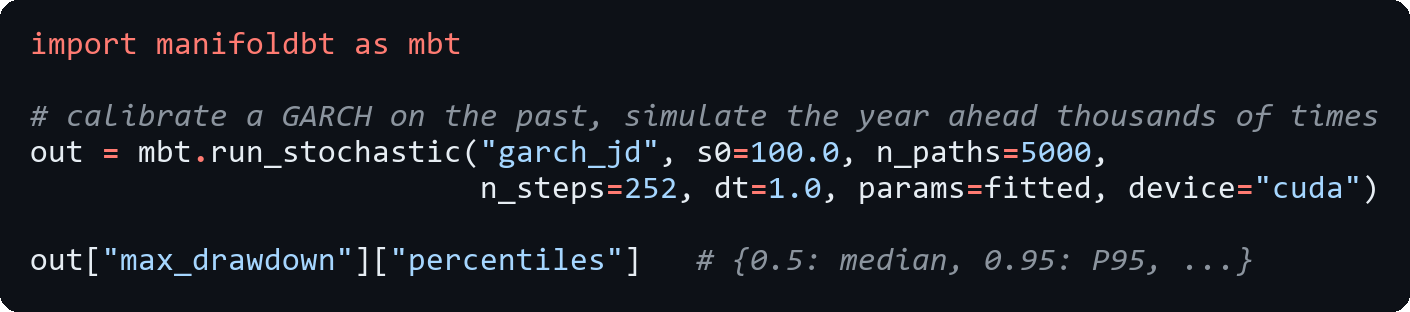
The −33.7 % is only one past realization. The drawdown that matters is next year’s, and estimating it means simulating many plausible return paths and, on each, looking at the worst trough it produces. A GARCH is built for this: it models what drives drawdowns, volatility that clusters and shocks with fat tails, calibrated on the past and simulated thousands of times over the year ahead.
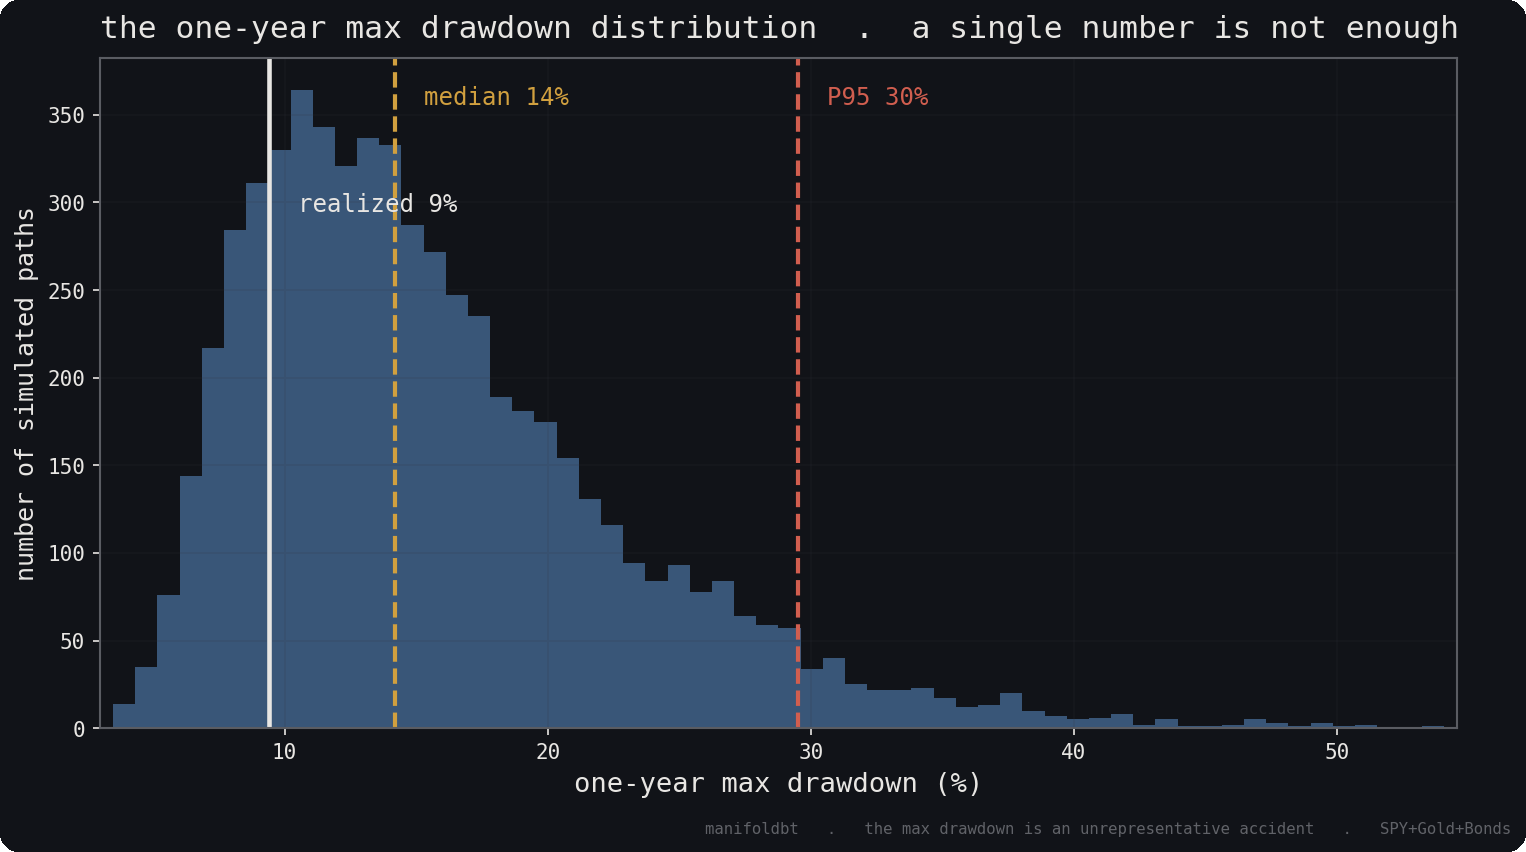
The one-year max drawdown distribution. The single realized figure (white line) is just one point; the distribution is wide and its tail stretches far.
Two markers are enough to read it. The median gives the drawdown of an ordinary year, the P95 that of a bad year, one in twenty. What matters is the gap between them, and on this portfolio the bad year is more than double the ordinary one. That is what a single figure could not show, and what the chart makes visible at a glance. A note on method in passing: these markers are one-year figures, whereas the −33.7 % we started from is a worst trough over nine years, two quantities that do not compare directly.
3. The median holds out-of-sample
A distribution is only worth anything if it holds out-of-sample. Three-year rolling window, simulate the drawdown of the year ahead, compare to what was realized. The final 30 % is set aside for a single OOS measurement.
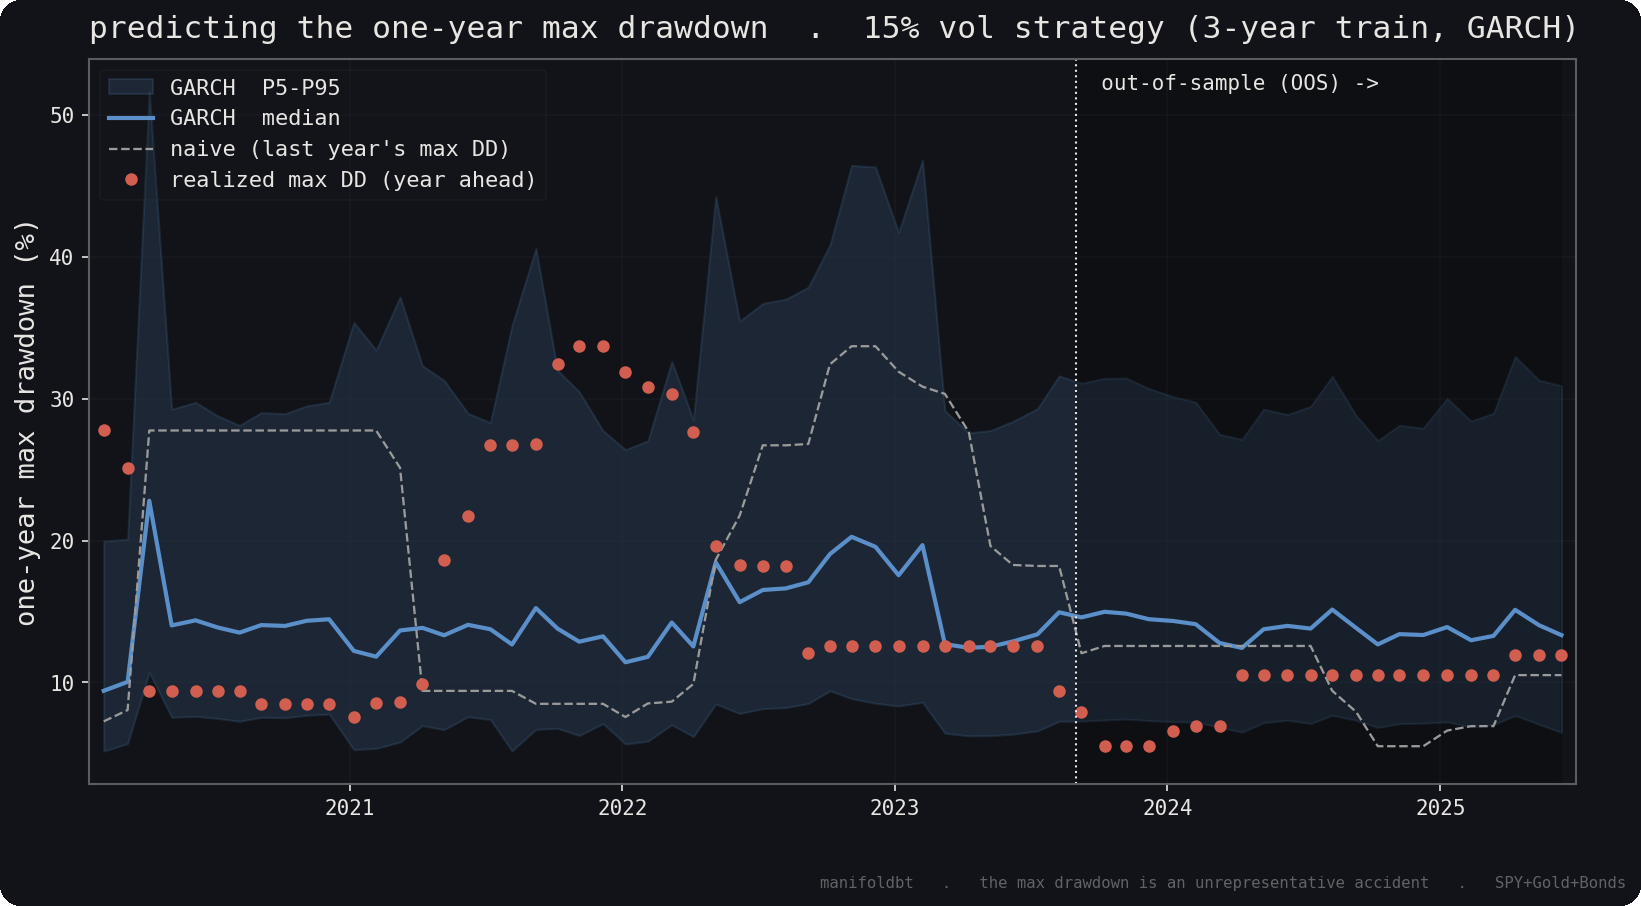
In red, the drawdown actually realized; in blue, the GARCH median and its P5–P95 band; dashed, the naive predictor (last year’s drawdown). To the right of the line, the OOS.
The naive predictor, which takes last year’s drawdown as its forecast, is erratic, with a median error of 18 points. The GARCH median is stable and off by only 6 points, three times better. The single past figure is the worst guide, the distribution the best. Out-of-sample, the realized values fall back inside the band.
4. Size leverage on the P95
Once the distribution is validated, it does something the single figure never could: it sets leverage. The usual approach suffers the drawdown, this one inverts it. First fix the loss you accept in a bad year, then find the volatility target whose max drawdown P95 matches that tolerance. On this portfolio, recalibrating the GARCH for each volatility target:
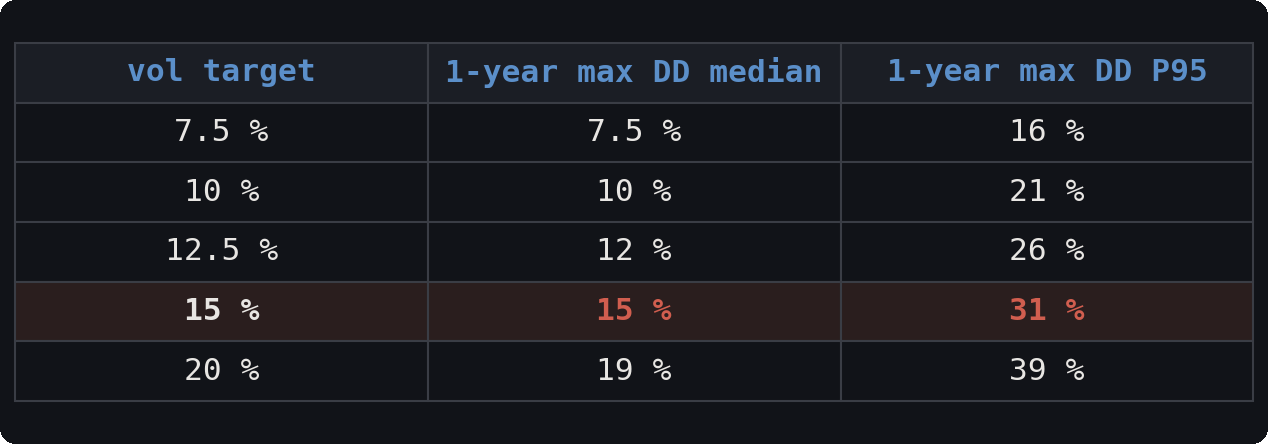
Read it backwards: accepting at most 20 % drawdown in a bad year points to a volatility target near 9 %, not 15. And the 15 % version used here means accepting, one year in twenty, a drawdown of around 30 %. The drawdown stops being a number you discover after the fact. It becomes a budget you set beforehand.
5. Two limits
First, the history is short, nine years, and the bonds only go back to 2016. Few independent years to estimate a tail, and the OOS figures rest on few cases.
Second, the P95 under-covers the unprecedented regime. The model is calibrated on the past, and a shock the past never produced, such as the simultaneous fall of equities and bonds in 2022, catches it out. The P95 is a useful floor, not a guarantee. No model manufactures a risk its sample has never seen.
6. Takeaway
A realized max drawdown is neither a property of the strategy nor a ceiling on future risk. It is a single draw, memoryless, usually far below the true tail. It deserves less weight than it is given.
Don’t quote the number. Simulate its distribution. Size leverage on its tail.

Engine: manifoldbt · GitHub · Discord